Performance Monitoring (E20)
Available in Enterprise Edition E20.
Performance monitoring support enables a Mattermost server to track system health for large Enterprise deployments through integrations with Prometheus and Grafana.
The integration supports data collection from several Mattermost servers, particularly useful if you’re running Mattermost in high availability mode.
Contents
Deployment Guide
Details on integrating your Mattermost server with Prometheus and Grafana.
Installing Prometheus
1 - Download a precompiled binary for Prometheus. Binaries are provided for many popular distributions, including Darwin, Linux and Windows.
For install instructions, see Prometheus install guides.
2 - The following settings are recommended in the Prometheus configuration file named prometheus.yml:
# my global config
global:
  scrape_interval:     60s # By default, scrape targets every 15 seconds.
  evaluation_interval: 60s # By default, scrape targets every 15 seconds.
  # scrape_timeout is set to the global default (10s).

  # Attach these labels to any time series or alerts when communicating with
  # external systems (federation, remote storage, Alertmanager).
  external_labels:
      monitor: 'mattermost-monitor'

# Load rules once and periodically evaluate them according to the global 'evaluation_interval'.
rule_files:
  # - "first.rules"
  # - "second.rules"

# A scrape configuration containing exactly one endpoint to scrape:
# Here it's Prometheus itself.
scrape_configs:
  # The job name is added as a label `job=<job_name>` to any timeseries scraped from this config.
  - job_name: 'prometheus'

    # Override the global default and scrape targets from this job every 5 seconds.
    # scrape_interval: 5s

    # metrics_path defaults to '/metrics'
    # scheme defaults to 'http'.

    static_configs:
      - targets: ["<hostname1>:<port>", "<hostname2>:<port>"]
3 - Enable performance monitoring in the Mattermost System Console and specify the listen address. See more detail in our configuration settings documentation.
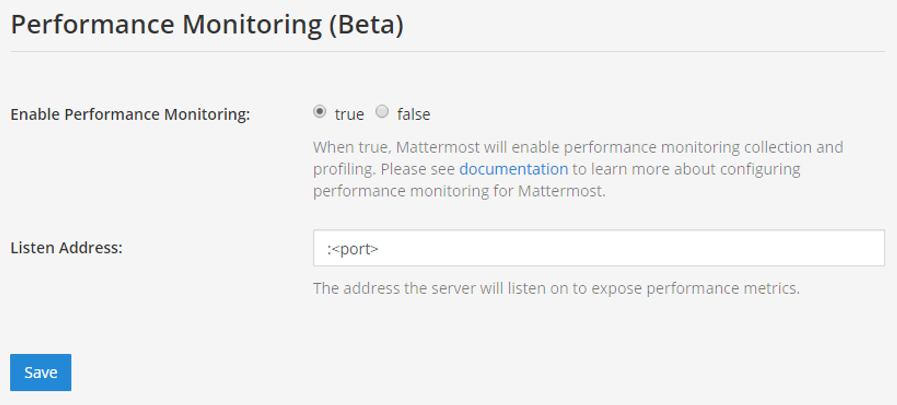
4 - To test the server is running, go to <ip>:<port>/metrics.
5 - Finally, run vi prometheus.yml to finish configuring Prometheus.
For starting the Prometheus service, read the comprehensive guides provided by Prometheus.
6 - Once the service has started, you can access the data in <localhost>:<port>/graph.
While you can use the Prometheus service to create graphs, we’ll focus on creating metric and analytics dashboards in Grafana.
Note
For troubleshooting advice, check the Prometheus FAQ page.
Installing Grafana
1 - Download a precompiled binary for Grafana on Ubuntu or Debian. Binaries are also available for other distributions, including Redhat, Windows and Mac.
For install instructions, see Grafana install guides
2 - The Grafana package is installed as a service, so it is easy to start the server. See their install guides to learn more.
3 - The default HTTP port is 3000 and default username and password are admin.
Note
For troubleshooting advice, check the Grafana Troubleshooting page.
For user guides and tutorials, check the Grafana documentation to learn more.
Getting Started
To help you get started, you can download three sample dashboards shared in Grafana:
- Mattermost Performance KPI Metrics, which contains key metrics for monitoring performance and system health.
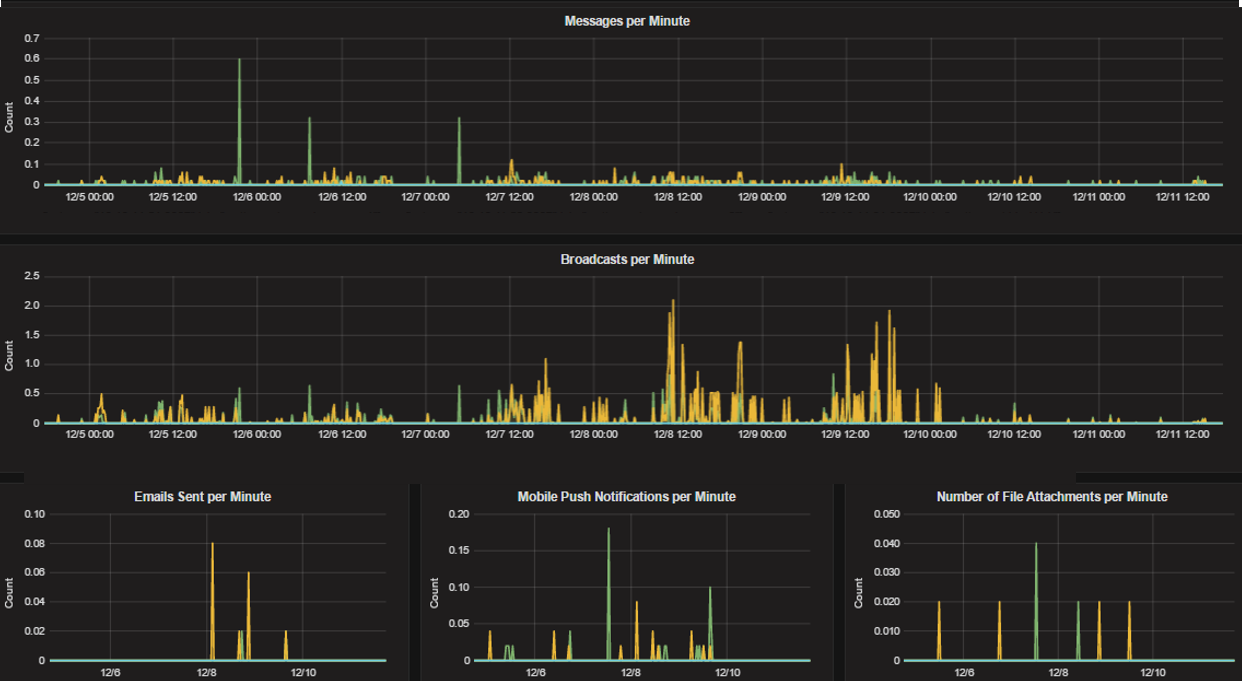
- Mattermost Performance Monitoring, which contains detailed charts for performance monitoring.
- Mattermost Performance Monitoring (Bonus Metrics), which contains additional metrics such as emails sent or files uploaded, which may be important to monitor in some deployments.
See this guide to learn how to import Grafana dashboards either from the UI or from the HTTP API.
Statistics
Mattermost provides the following performance monitoring statistics to integrate with Prometheus and Grafana.
Custom Mattermost Metrics
The following is a list of custom Mattermost metrics that can be used to monitor your system’s performance:
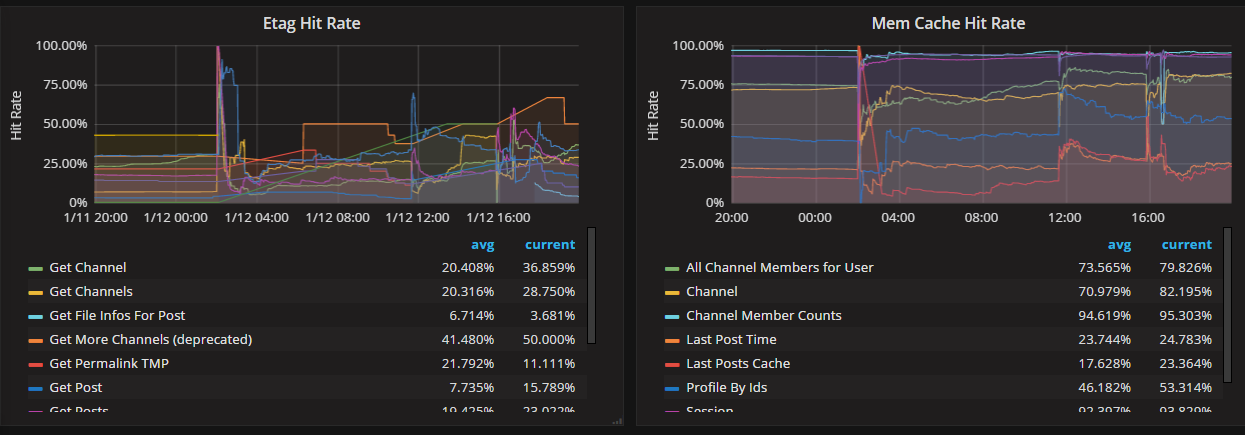
Caching Metrics:
mattermost_cache_etag_hit_total: The total number of ETag cache hits for a specific cache.mattermost_cache_etag_miss_total: The total number of ETag cache misses for an API call.mattermost_cache_mem_hit_total: The total number of memory cache hits for a specific cache.mattermost_cache_mem_miss_total: The total number of cache misses for a specific cache.
The above metrics can be used to calculate ETag and memory cache hit rates over time.
Cluster Metrics:
mattermost_cluster_cluster_request_duration_seconds: The total duration in seconds of the inter-node cluster requests.mattermost_cluster_cluster_requests_total: The total number of inter-node requests.
Database Metrics:
mattermost_db_master_connections_total: The total number of connections to the master database.mattermost_db_read_replica_connections_total: The total number of connections to all the read replica databases.mattermost_db_search_replica_connections_total: The total number of connections to all the search replica databases.
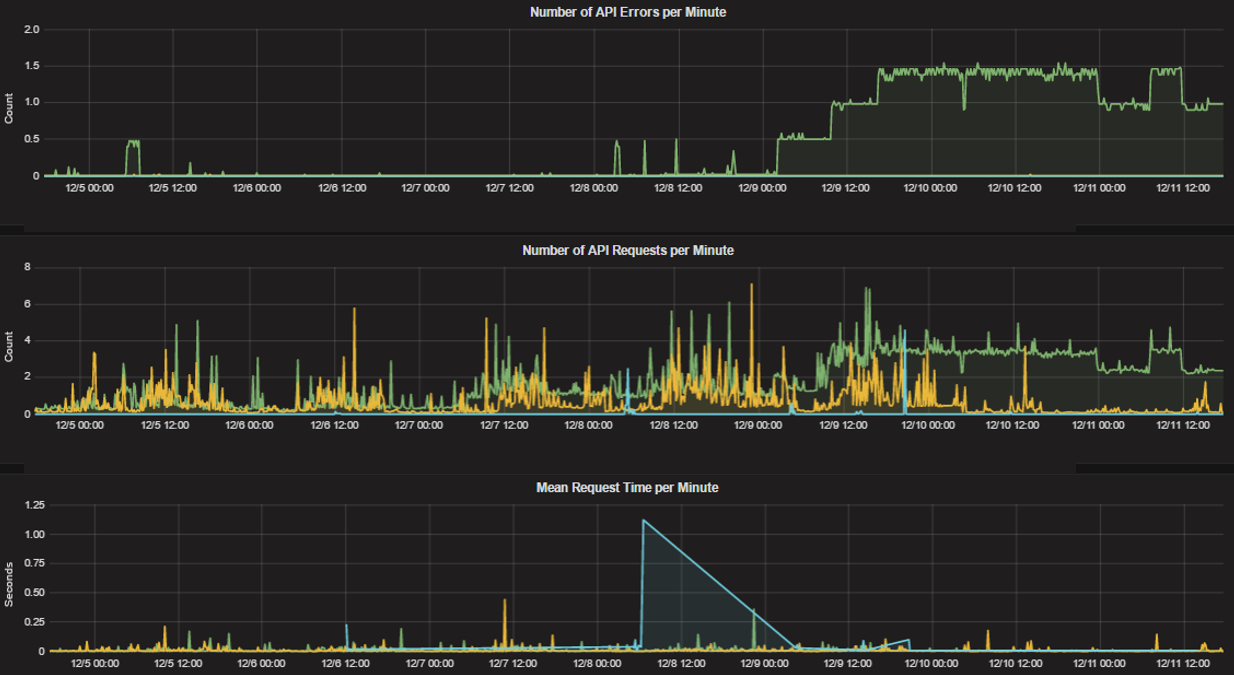
HTTP Metrics:
mattermost_http_errors_total: The total number of http API errors.mattermost_http_request_duration_seconds: The total duration in seconds of the http API requests.mattermost_http_requests_total: The total number of http API requests.
Login and Session Metrics:
mattermost_http_websockets_totalThe total number of WebSocket connections to the server.mattermost_login_logins_fail_total: The total number of failed logins.mattermost_login_logins_total: The total number of successful logins.
Messaging Metrics:
mattermost_post_broadcasts_total: The total number of WebSocket broadcasts sent because a post was created.mattermost_post_emails_sent_total: The total number of emails sent because a post was created.mattermost_post_file_attachments_total: The total number of file attachments created because a post was created.mattermost_post_pushes_sent_total: The total number of mobile push notifications sent because a post was created.mattermost_post_total: The total number of posts created.mattermost_post_webhooks_totals: The total number of webhook posts created.
Process Metrics:
mattermost_process_cpu_seconds_total: Total user and system CPU time spent in seconds.mattermost_process_max_fds: Maximum number of open file descriptors.mattermost_process_open_fds: Number of open file descriptors.mattermost_process_resident_memory_bytes: Resident memory size in bytes.mattermost_process_start_time_seconds: Start time of the process since unix epoch in seconds.mattermost_process_virtual_memory_bytes: Virtual memory size in bytes.
WebSocket Metrics:
mattermost_websocket_broadcasts_total: The total number of WebSocket broadcasts sent by type.mattermost_websocket_event_total: The total number of WebSocket events sent by type.
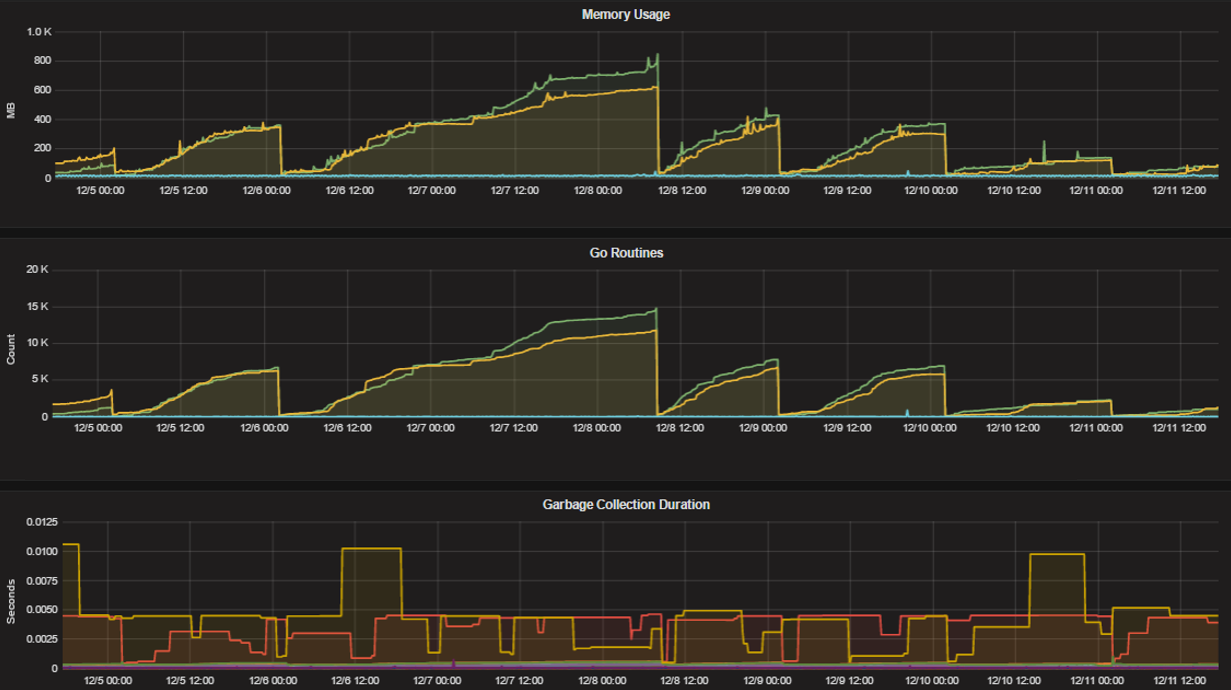
Standard GO Metrics
The Prometheus integration also provides standard GO metrics for HTTP server runtime profiling data and system monitoring, such as:
go_memstats_alloc_bytesfor memory usagego_goroutinesfor GO routinesgo_gc_duration_secondsfor garbage collection durationgo_memstats_heap_objectsfor object tracking on the heap
To learn how to set up runtime profiling, see the pprof package GO documentation. You can also visit the ip:port/metrics page for a complete list of metrics with descriptions.
If enabled, you can run the profiler by
go tool pprof channel http://localhost:<port>/debug/pprof/profile
where you can replace localhost with the server name. The profiling reports are available at <ip>:<port>, which include:
/debug/pprof/ for CPU profiling/debug/pprof/cmdline/ for command line profiling/debug/pprof/symbol/ for symbol profiling/debug/pprof/goroutine/ for GO routine profiling/debug/pprof/heap/ for heap profiling/debug/pprof/threadcreate/ for threads profiling/debug/pprof/block/ for block profiling